🎧 Listen to the deep-dive discussion – Buy and Hold Is a Mathematical Trap (15:02 min)
This book begins where most investment frameworks stop: with the mathematical nature of reality itself. Before allocation, before selection, before returns, there is the question of survival over time.
Investors are taught the same fundamental truth: stocks go up over time.
The chart is familiar—the S&P 500 climbing from the bottom-left corner to the top-right—accompanied by reassuring advice: buy, hold, and wait. The market rewards patience. Time in the market beats timing the market. Stay the course.
For the index, this is true.
For individual stocks, this is often a dangerous lie.
The Broken Promise
The promise of “buy and hold” rests on a hidden assumption: that all stocks behave like the market. They do not.
The market is an average. But investors do not own the average. They own specific companies—five, ten, twenty names chosen based on belief in their future. And here lies the trap: the average masks a brutal underlying reality.
Most stocks fail.
Not “underperform.” Not “lag the benchmark.” They fail to create any wealth whatsoever. The chart that goes up and to the right is the result of a handful of extraordinary winners dragging the entire index upward, while the majority of its components contribute nothing—or worse, destroy value.
Conventional wisdom holds that time is the investor’s friend. But time is only a friend to those who own the winners. For the rest, time is a slow bleed.
The Bessembinder Reality
In 2018, Hendrik Bessembinder published a study that should have ended the “buy and hold anything” mythology forever. His findings were stark:
- 4% of stocks generated all of the net wealth in the U.S. stock market since 1926.
- 96% of stocks collectively matched the return of Treasury Bills—risk-free government bonds.
- The median stock (not the average—the median) underperformed T-Bills over its lifetime.
The typical stock—the one in the middle of the distribution—failed to beat the safest, most boring investment available.
This is not a bell curve. This is a Power Law.
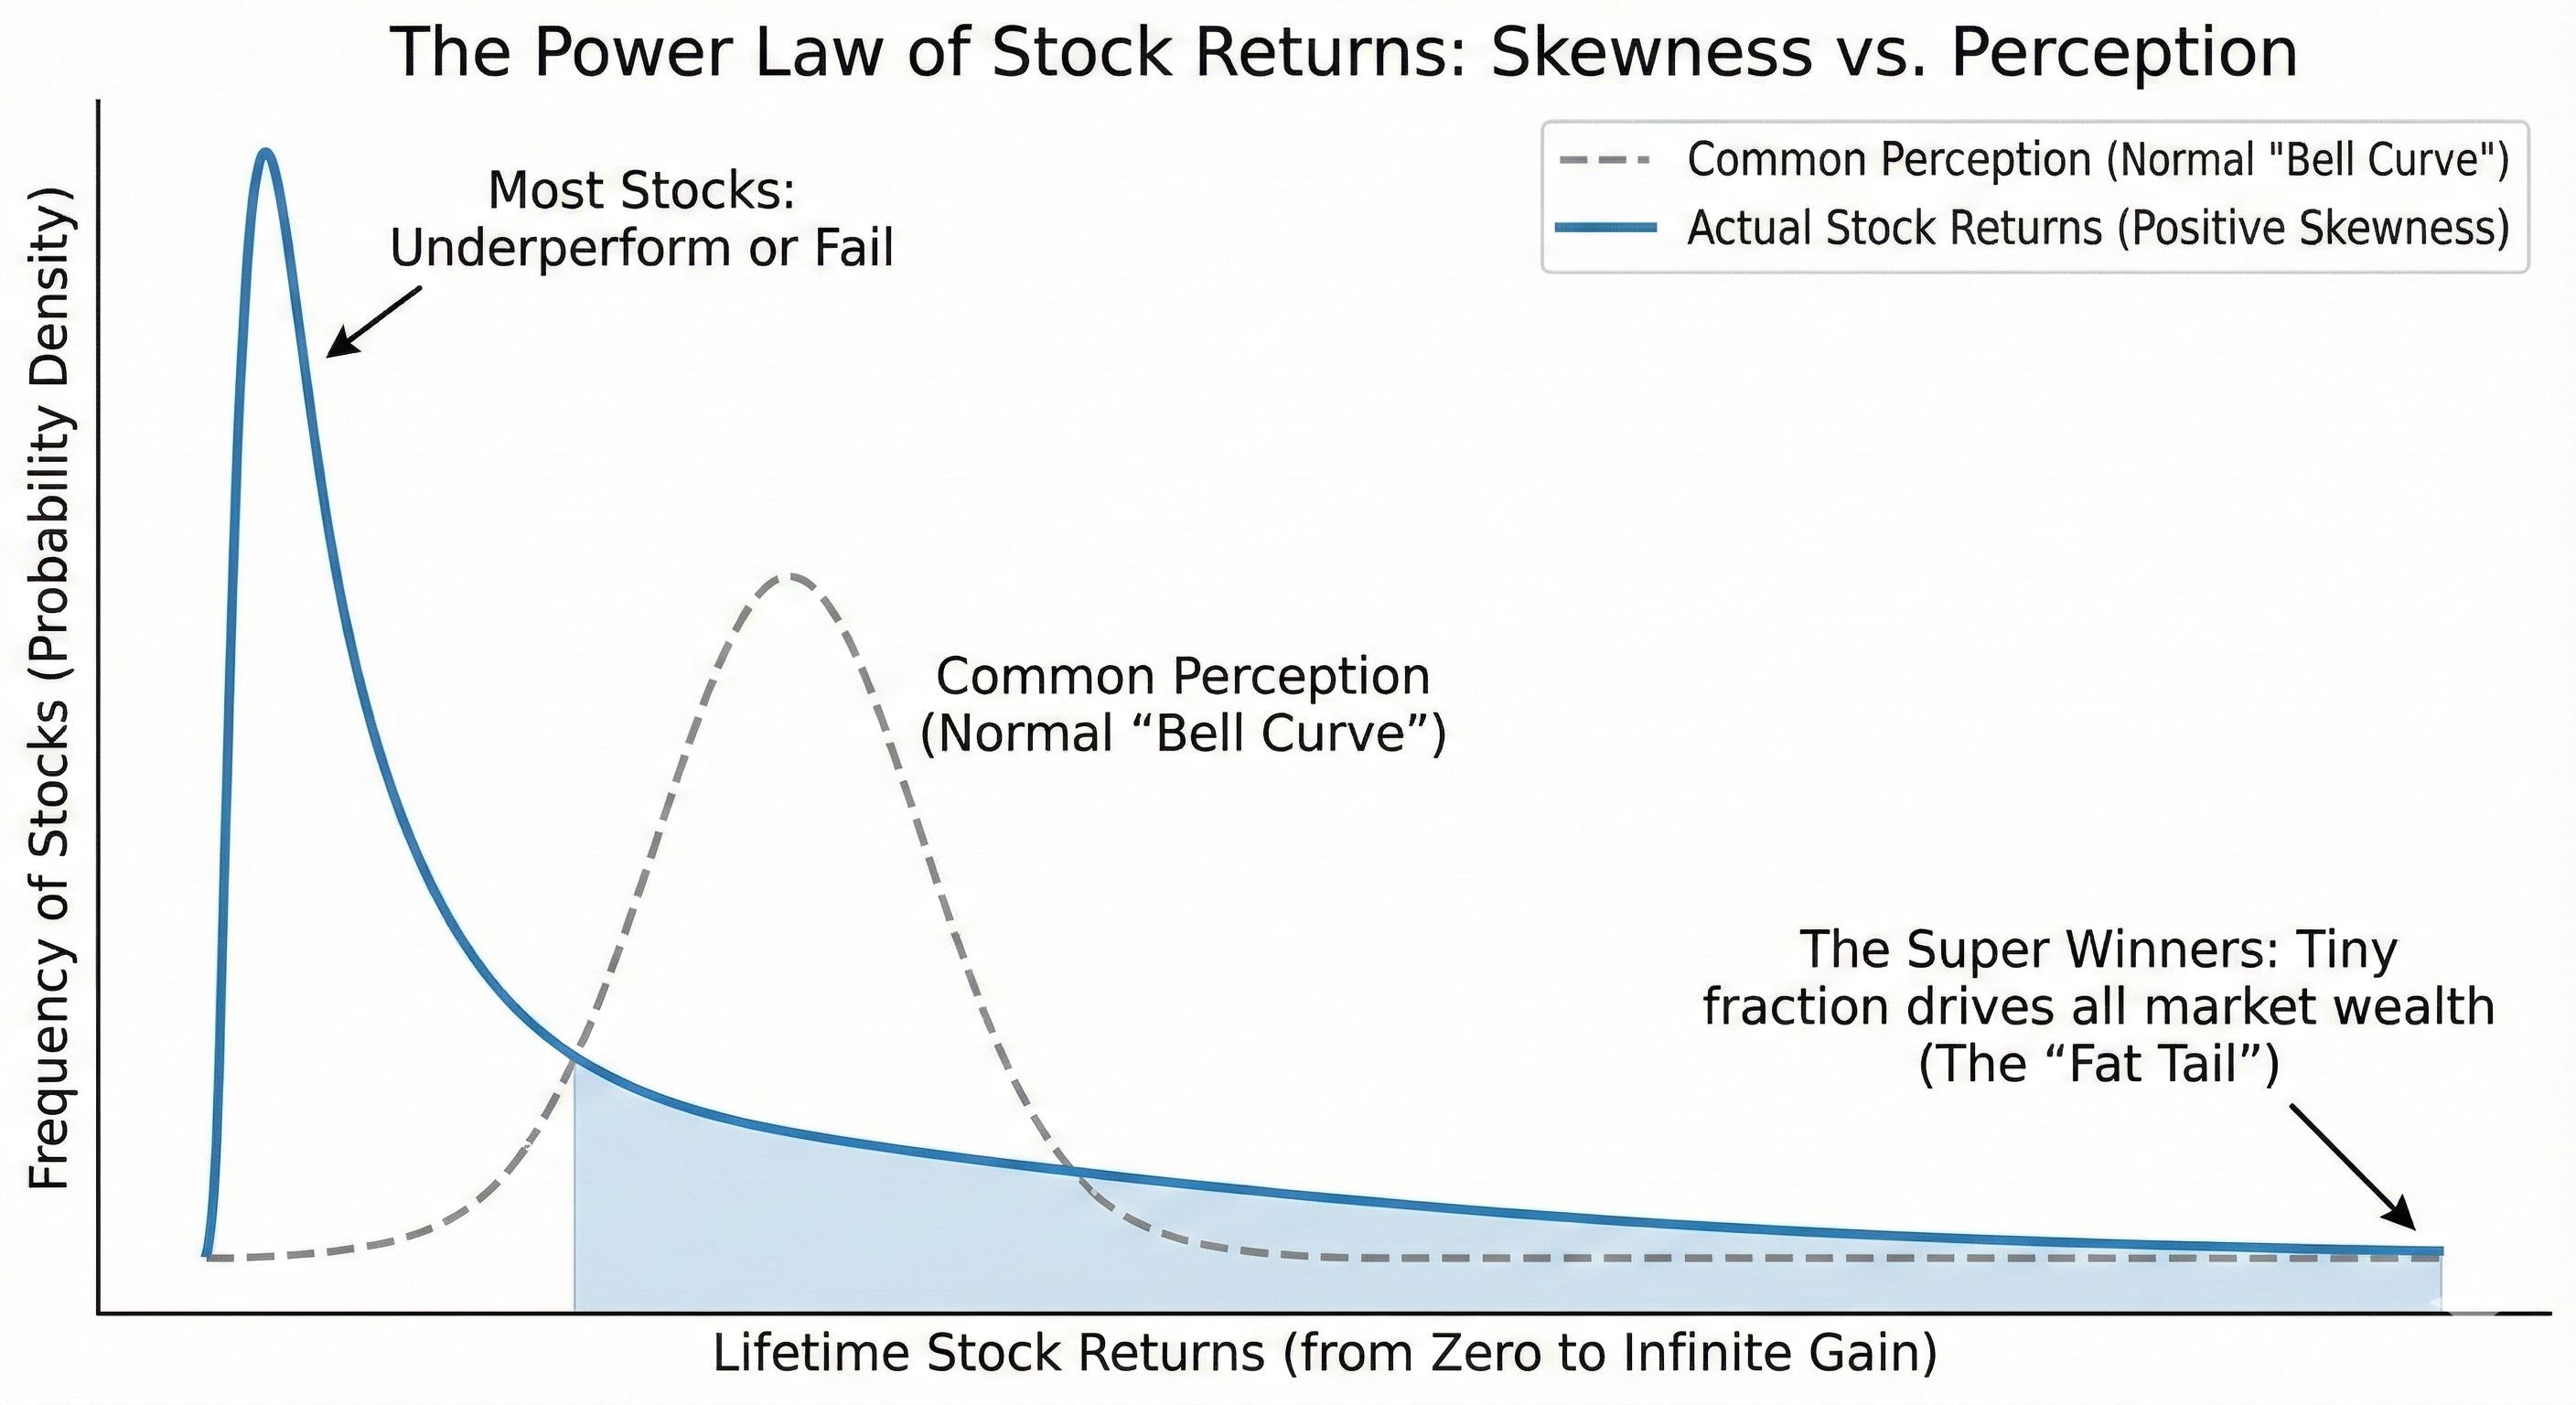
The distribution of stock returns looks nothing like the normal distribution taught in statistics class. The dashed line—the bell curve—is what most investors assume. The solid line is reality. There is no gentle clustering around the mean. Instead, there is a massive pile-up on the left (the losers), a thin sliver in the middle (the survivors), and a tiny spike on the far right (the super-winners)—the “Fat Tail” that drives all market wealth.
Market returns are not driven by the average company performing averagely. They are driven by a microscopic minority of outliers pulling the entire index upward. Apple, Microsoft, Amazon, Google—remove a handful of names, and the last two decades of market performance look very different.
This is the Bessembinder Reality: in a concentrated portfolio, the statistical probability of picking a long-term loser is overwhelming. Investors are not picking from a pool of “mostly average” companies. They are picking from a pool where most will disappoint, many will fail, and a few will change everything.
The Invisible Tax
A second force works against the investor, quieter but equally destructive: Volatility Drag.
Consider a simple example. A stock falls 50%. To return to even, it must rise 100%. Not 50%—100%. The math is asymmetric, and it does not favor the investor.
This is not just arithmetic. It is a compounding problem. The more a stock swings—up 30%, down 25%, up 40%, down 35%—the more the actual compound return diverges from the simple average return.
The screen may show an “average annual return” of 10%. But the account grows at 7%. Where did the other 3% go?
It was taxed away by volatility.
This gap—between the arithmetic average and the geometric (compound) return—is called Volatility Drag, or Variance Drain. It is invisible on most brokerage statements. It does not appear as a fee or a charge. But it erodes wealth just the same.
The more volatile the asset, the higher the tax. And unlike capital gains tax, this one cannot be deferred. It is paid continuously, silently, with every swing.
This is why two portfolios with identical average returns can produce wildly different outcomes. The one with lower volatility compounds faster. The one with higher volatility pays more tax to the math gods.
The Terrain
This is the terrain investors must navigate:
- Skewness — Most stocks will disappoint. A tiny minority will drive all the returns.
- Volatility — Even among the survivors, the journey will erode wealth.
- The Index Exception — The market as a whole masks these realities through automatic rebalancing, survivorship, and diversification.
The S&P 500 rises over time because it is a self-cleansing system. It ejects the losers and adds the winners. It is not a static portfolio—it is an algorithm that guarantees ownership of the 4%, because its rules force them to the top.
An individual portfolio has no such mechanism. One must be built.
The map has been drawn. The terrain is hostile: skewed distributions, invisible taxes, and a broken promise that “stocks always go up.”
What is needed now is a destination, a structure, and a set of instruments to navigate.
That is what this system provides.